|
||||||||||||||||
|
What's in q-status™
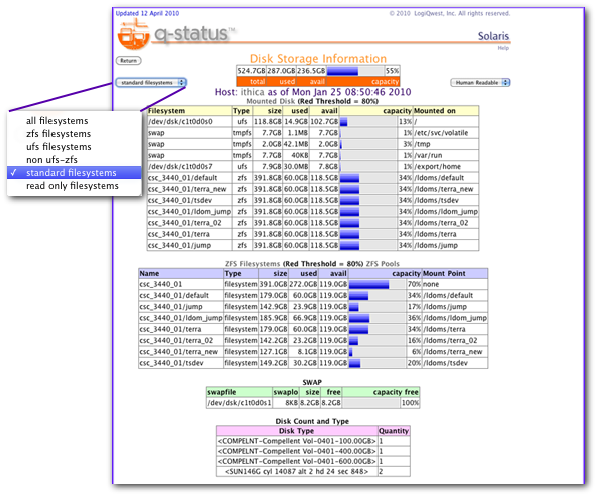
Filetype Disk Reporting:
For Solaris, Linux, and Windows, q-Status™ provides disk type filtering such as ufs filesystem, read-only files system (e.g. cdrom, loop back file system. In Solaris, the zfs file filesystem is broken out separately as well as filtered.
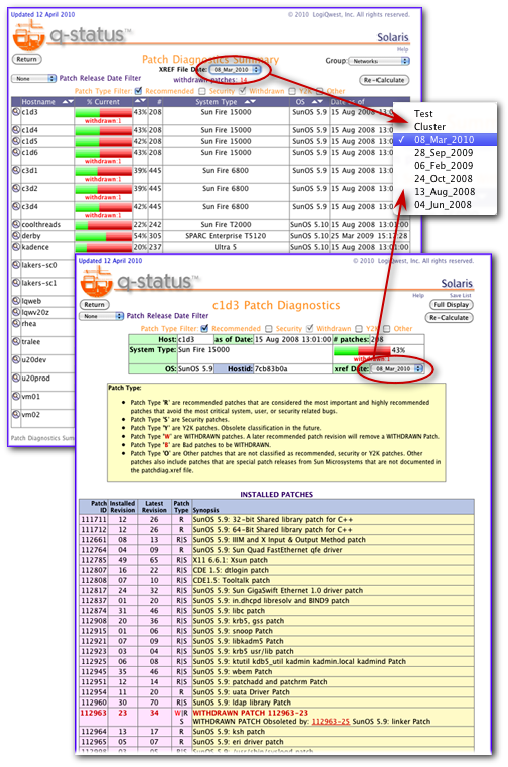
Solaris Path Diagnostic Analysis Pulldown:
q-status™ Solaris patchdiag analysis now supports selection of multiple patchdiag.xref files from a pulldown.
Patchdiag analysis generates for the entire data center or a server group set an analysis of the installed patches versus the available patch set as a percentage bar graph.
This analysis supports dynamic filtering to analyze only "Recommended" and or "Security" patches. Dynamic release patch date is supported to for conservative patch policies. The q-Status™ reports Patch Withdrawn notification for immediate patch removal or withdrawn.
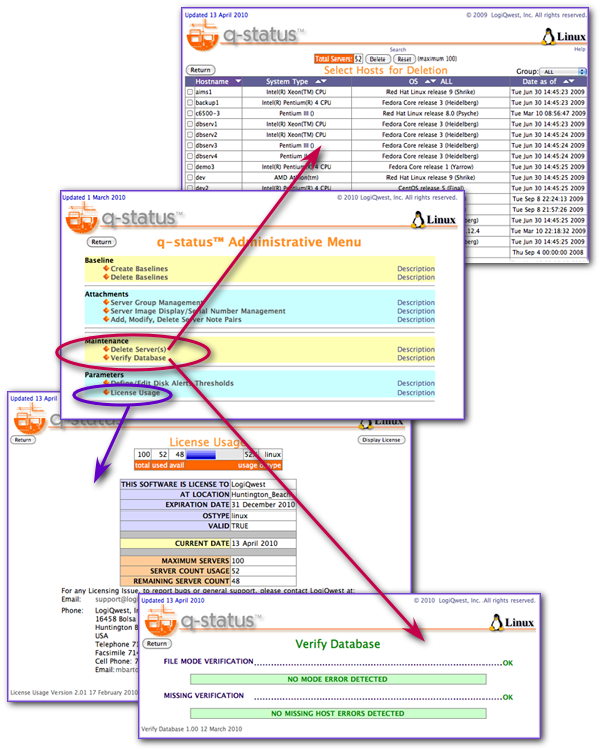
New Administrative Functions:
New to Solaris, Linux, and Windows, q-Status™ provides new administrative functions including "Delete" Server, "Verify Data Base" and "License Usage".
"Delete Server" deletes all references to a server including any of its baselines. "Verify Data" check mode assignments.
LDom's Configuration
The new release of q-Status™ Solaris (Update 2) now supports display of Sun Logical Domains (Ldoms) configurations. This includes graphical display of the associated LDom servers with allocated and unallocated resources and virtual network interfaces cross referenced to physical interfaces. General server information has now been updated to identify LDom server as either primary LDom and cross referencing the other LDoms or as regular LDom cross referencing to the primary. The q-Status™ Solaris Server Summary generates a list of all servers in the data center has been enhanced to identify LDom server.
The new Solaris LDom enhances will also integrate to LogiQwest q-Status™ View Server Summary to display LDoms as well as the other Virtual server such Zones, xVm and VMware servers.
Click This Link to see Web Video.
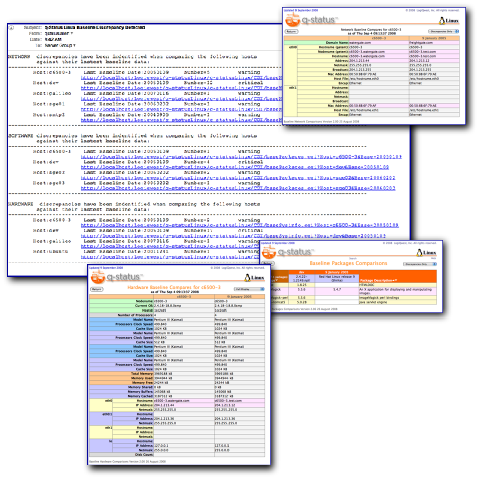
q-Status Baseline Alerts
q-status™ baseline discrepancies alert is an automatic email notification system if a discrepancy is evaluated between the latest q-status™ baseline and the current system. It is useful to identify changes to the system or validate that a change has been completed.
A simple crontab entry will execute a script to compare the most recent baselines for Packages, Network and Hardware and create an alert email of any discrepancies found. The email is then sent using smtp to a users in a configurable mailing list.
q-status™ Baseline Email Alerts requires little configuration set up to implement. Baseline discrepancy alerts are clear by simply generating a new baseline. If no discrepancies are found, no email baseline discrepancy alerts are sent. Available with q-status™ 5.1.
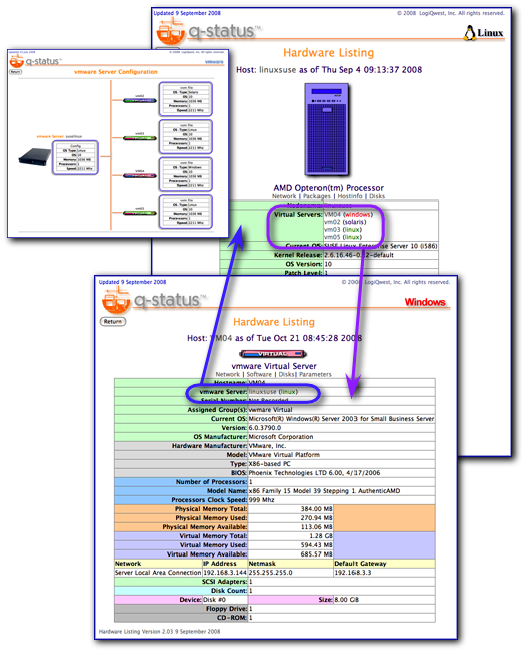
vmware Integration
q-status™ now support vmware integration. When q-Status VMWARE is implemented with q-Status Linux, q-Status Windows or q-status™ Solaris, the assocaition between the virtual server and its physical hardware server is identified.
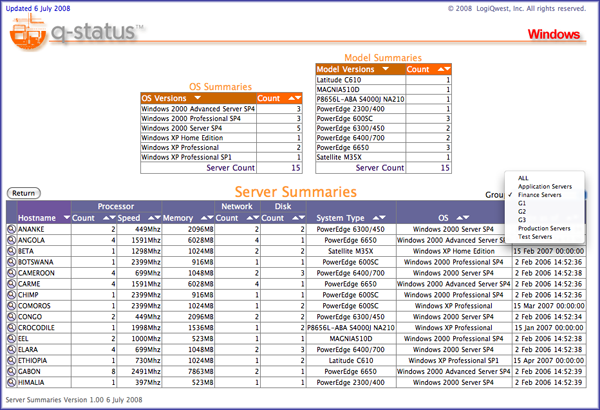
Server Summaries
Starting with q-status™ Windows, all version of q-status™ will now include the Web 2.0 Server Summary Engine. This new report functions will list all servers in the data center, identifying running OS revision, model type, memory and CPU clock speed. In addition, the report will identify single points of failure by listing the number of active network interfaces and disk drives. Utilizing JSON sorts and filtering, this dynamic report provides a complex sorting capability, group filtering to show only servers in a specific set (e.g. Finance servers), and summaries number of model types and running OS version. Very useful to monitor future update requirements and allowing project managers to evaluate current system architectures.
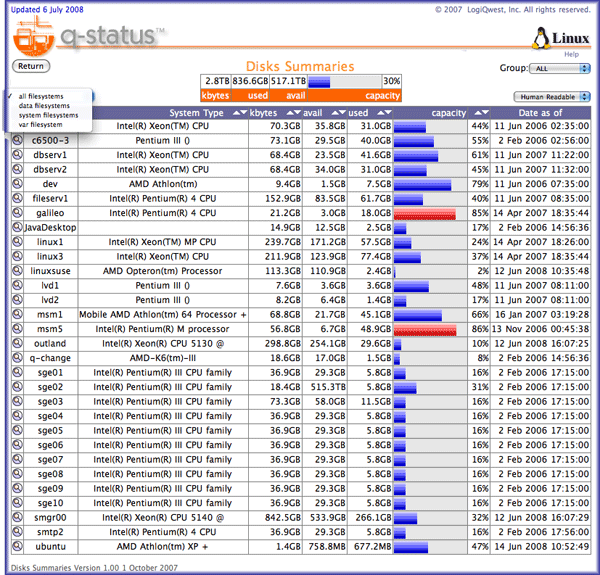
Disk Summaries: For all OS versions, q-status™ Rev 5 Server Analysis software expands the use of Web 2.0 technologies to streamline dynamic reporting and analysis with a new disk summary report. Disk summary not only ion one dynamic report provides a total summary of all disk space used in the data center and even breaks downs usage by filesystem types (e.g. data filesystems, temp file systems [var] and system file system). Summaries can be filter by server sets such as Commerce Servers or database servers. The disk summary report easily identifies which servers have the most free space available and which servers have the most disk space used.
The new disk summary report summarizes the total disk space used and disk space available with dynamic filtering for all the server in the data center at the same time. “We are very proud of the new disk summary report as it easily provides answers IT has long searched for”, Michael Barto – lead product evangelist said – “It identifies which servers have the most free space available and which servers have the most disk space used.”
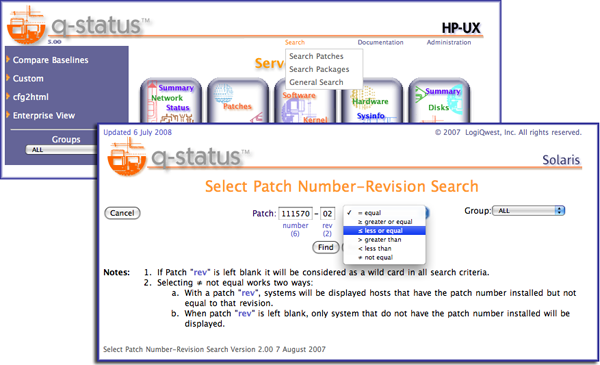
Packages, Patches and General Search: All q-status™ OS versions also include search filtering for packages patches and general search. Patches and Package search can filter down to version or patch number. General search filters by raw data type and can be used to generate a list of servers which have installed a specific type of I/O board.
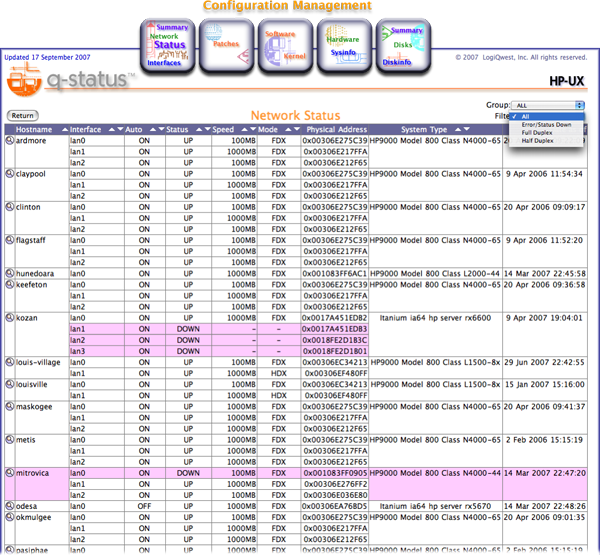
Network Status:
q-status™ now report Network Status reports summarizes all network interface in the data center in one report display, sorting and filtering to their status, speed, full or half duplex or auto negotiate on or off.
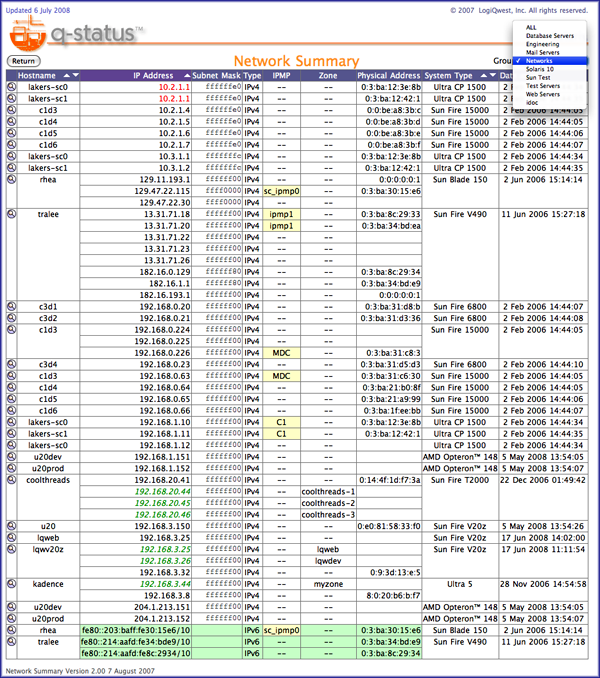
Network Summaries:
The Network Summary Generates the entire data center network summary for all servers. It will identifies duplicate IP’s and identifies single points of failure. For q-Status Solaris, Zone IP's are summarized, and displays network multi-pathing groups.
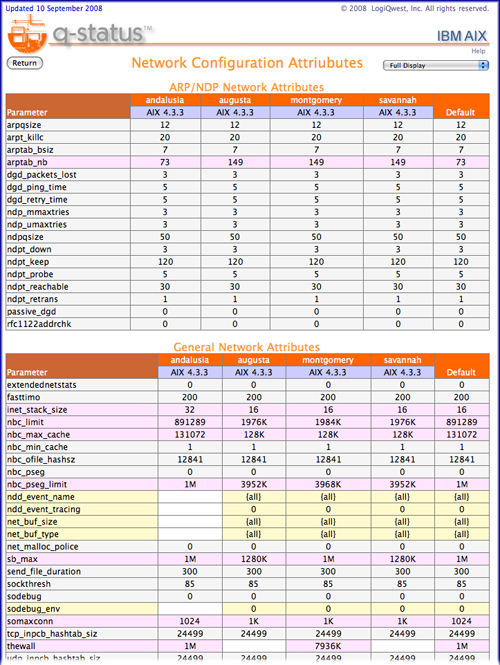
AIX Network Attribute Comparison:
q-status™ AIX now provides a simple method to compare AIX network parameters across multiple servers. This allow network tuning issues to be quickly and accurately evaluated.
Home